How to Read Candlestick Patterns
What a candle actually shows, and the handful of patterns worth learning first -- doji, hammer, engulfing, and the morning/evening star.
What a candle actually shows, and the handful of patterns worth learning first -- doji, hammer, engulfing, and the morning/evening star.
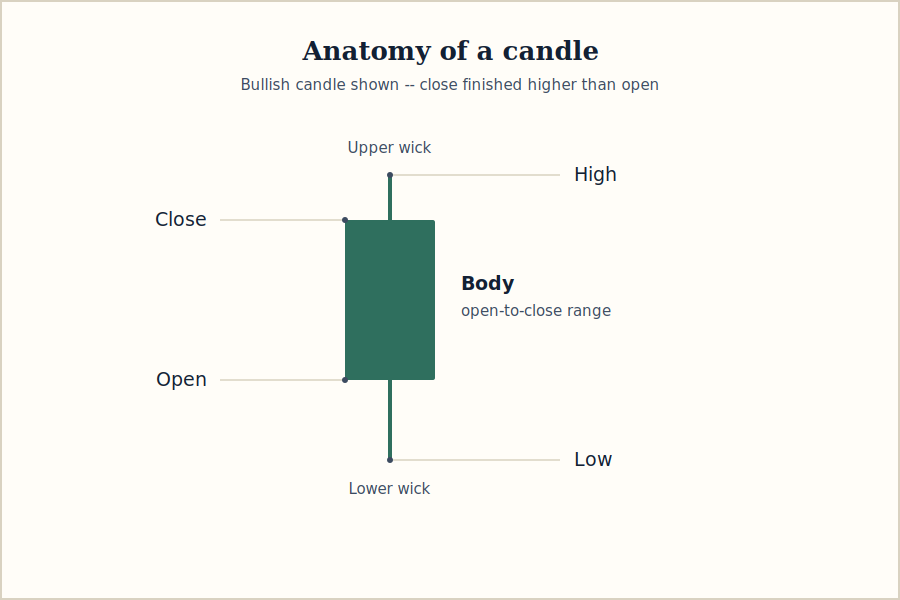
A candlestick chart shows four prices for every time period you’re looking at: the open, high, low, and close. That’s it — but arranged the right way, those four numbers tell you a lot more than a simple line chart ever could.
Each candle has a body and, usually, two wicks (also called shadows). The body is the range between the open and close price. The wicks show the highest and lowest prices reached during that period, even if price didn’t stay there.
Color tells you direction: a candle where price closed higher than it opened is usually shown in green or white (“bullish”). One that closed lower than it opened is usually red or black (“bearish”). A long body means strong, decisive movement in one direction. A tiny body with long wicks means the price moved a lot during the period but ended up close to where it started — a tug of war.

No candlestick pattern works in isolation, and none of them predict the future with any reliability on their own. What experienced traders do is treat a pattern as one piece of evidence — more meaningful when it shows up at an existing support or resistance level, alongside rising or falling volume, or in the context of the broader trend, than it is sitting in the middle of nowhere on the chart.
Treat candlestick reading as a skill you layer onto a broader trading plan and risk management approach, not a shortcut that replaces one. This article is educational only and isn’t a recommendation to trade any particular instrument.
The eight patterns above cover the essentials. Each of the 45 named patterns below has its own in-depth page covering exactly how to identify it, what it signals, and how reliable it tends to be.